
Grade & Performance Analytics
Visualize grade distributions, class averages, gender comparisons, and performance stats in real-time.
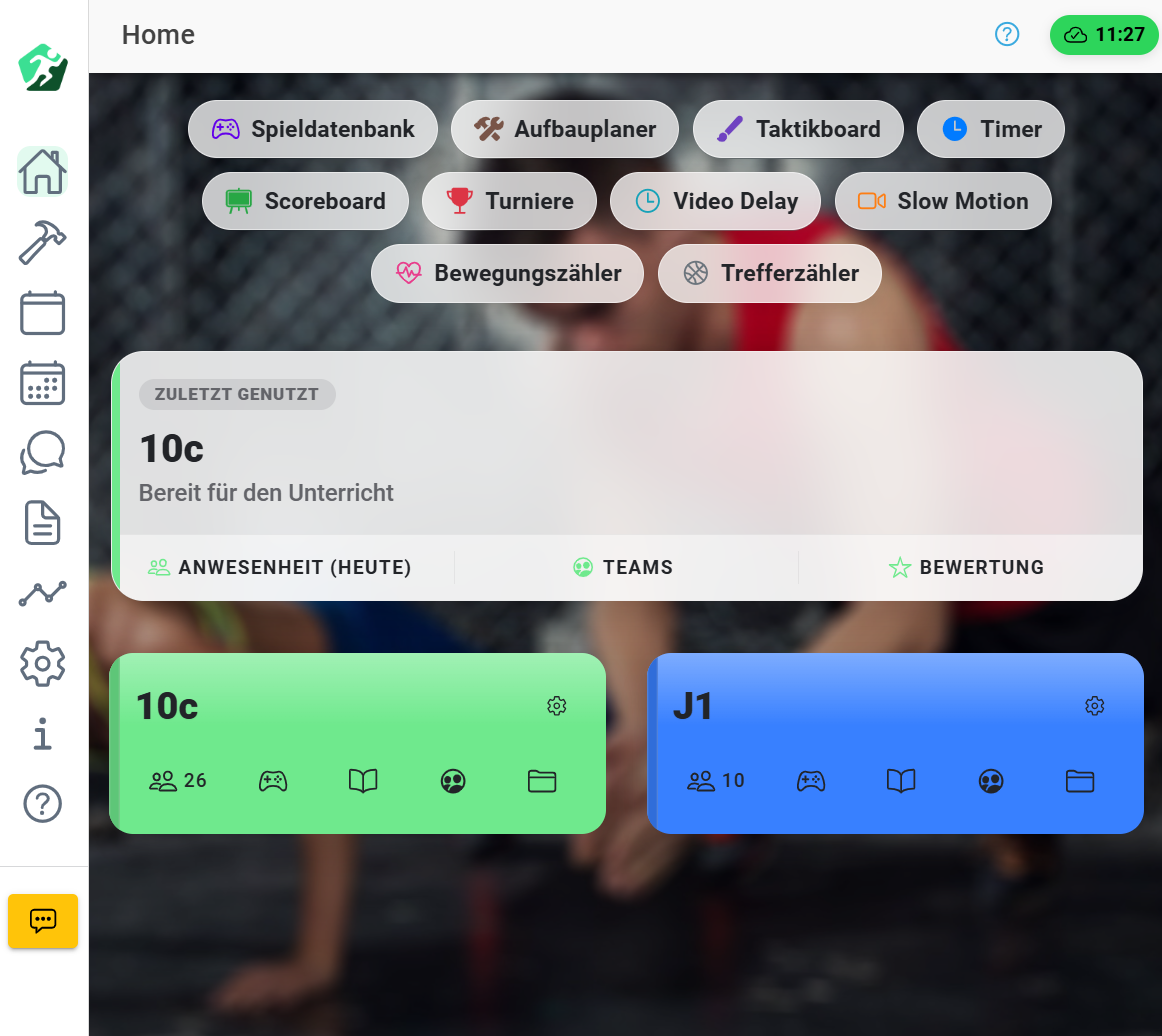
The Grade & Performance Analytics Dashboard in SportZens turns your physical education data into actionable pedagogical insights. Instead of manually calculating grade distributions on paper, get visual charts and statistics across classes at the touch of a button.
Grade Distribution & Visual Charts
- Visual Grade Breakdown: Interactive charts display the distribution of grades for specific categories or overall performance.
- Class Averages & Key Metrics: View class averages, total student counts, and active classes in real-time KPI cards.
- Gender Performance Comparison: Analyze performance differences transparently to tailor lesson plans.
Progress & Trend Tracking
Track how your classes evolve over the school year. Compare performance across terms or sports disciplines, providing solid data for department meetings and parent conferences.